Gateways
Gateway List View
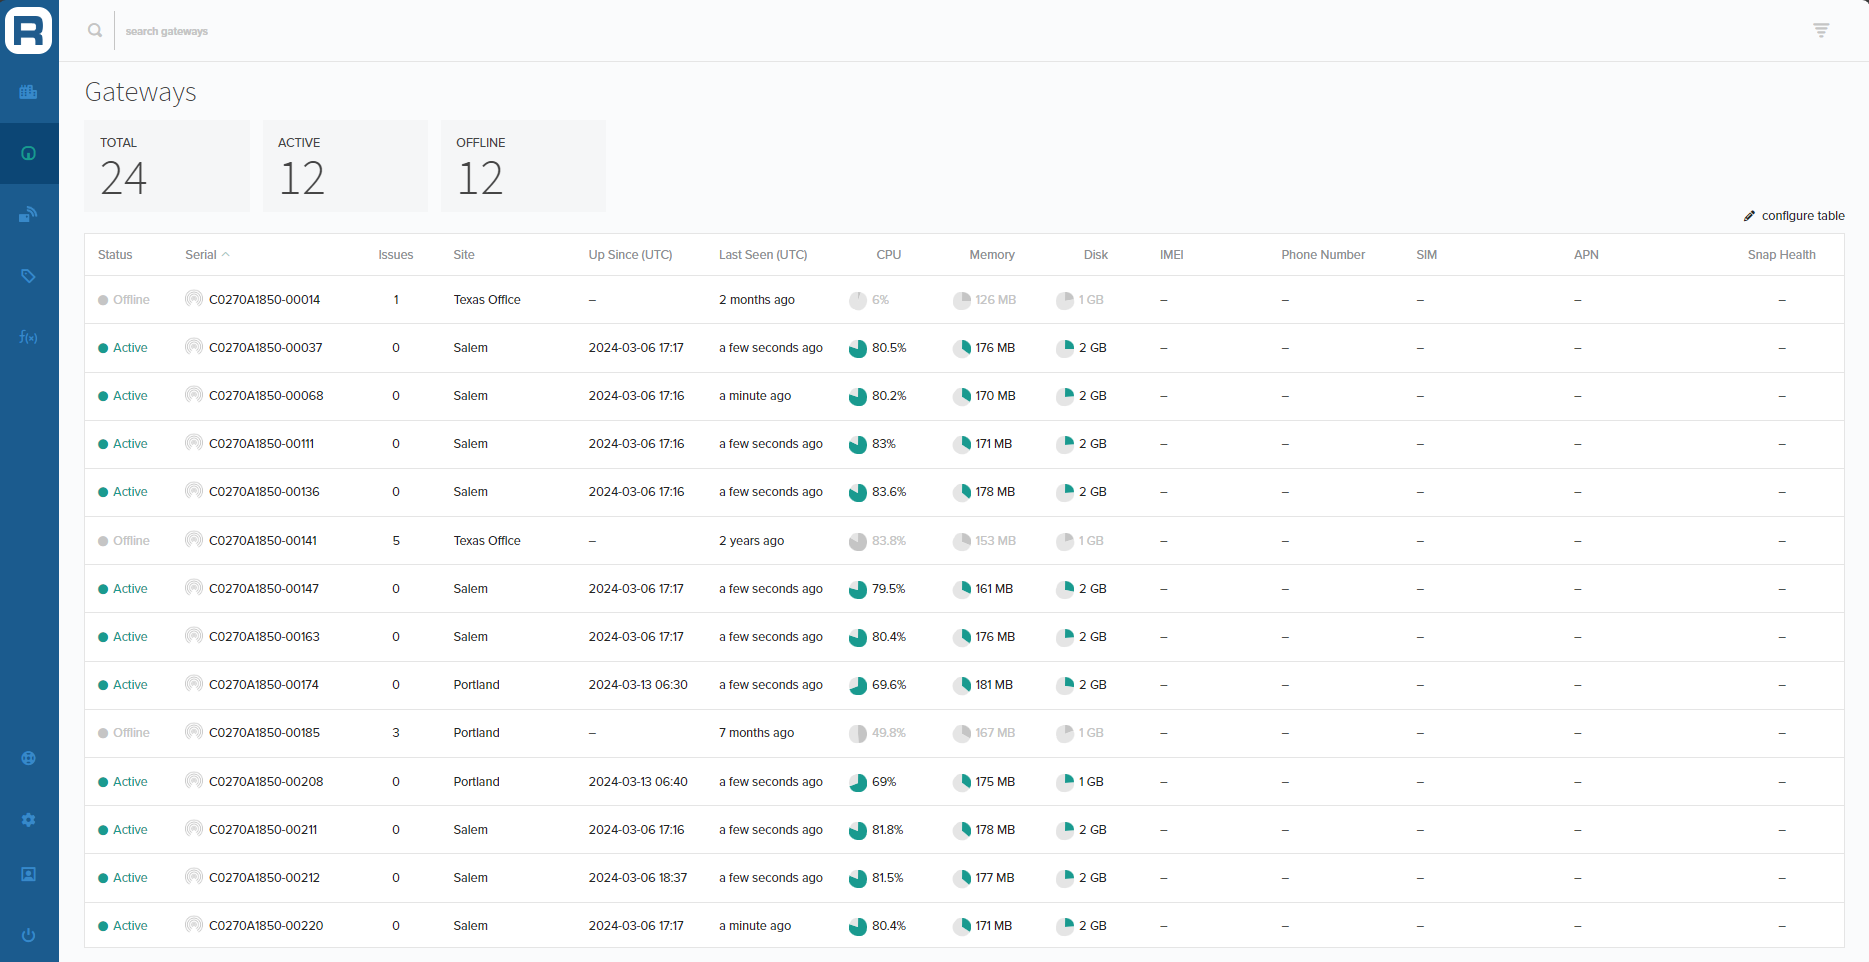
The Gateways page is where you can see all your organization's Gateways and verify that they are online. They will periodically report status information, including:
- Health Status and number of Issues present
- Stability metrics such as up-time and "last seen" time
- Performance metrics including CPU usage, memory usage, and disk usage
- Lists of Gateway events like checking for updates or restarts
- Network interface details, including all relevant IP addresses
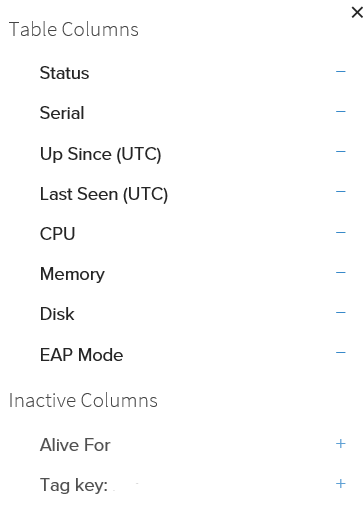
You can tailor your Gateway dashboard to your workflow. Start customizing your columns by clicking configure table above the Gateway list. You will see a list of configurable items, including all of the tag keys available in your organization.
You can also search for an individual Gateway by entering the Gateway serial in the search field, or you can filter the list of gateways on your dashboard by selecting the tab icon in the upper right of the page and selecting which tags you'd like to view the associated gateways for.
How does Edge Direct know about your Gateway device? When you subscribe to Edge-as-a-Service and receive one or more Gateway devices, each of those devices has been provisioned into Edge Direct using its unit serial number as a unique identifier. Each device is programmed to communicate directly with Edge Direct. Gateways stay in contact with Edge Direct once per minute.
Gateway Detail View
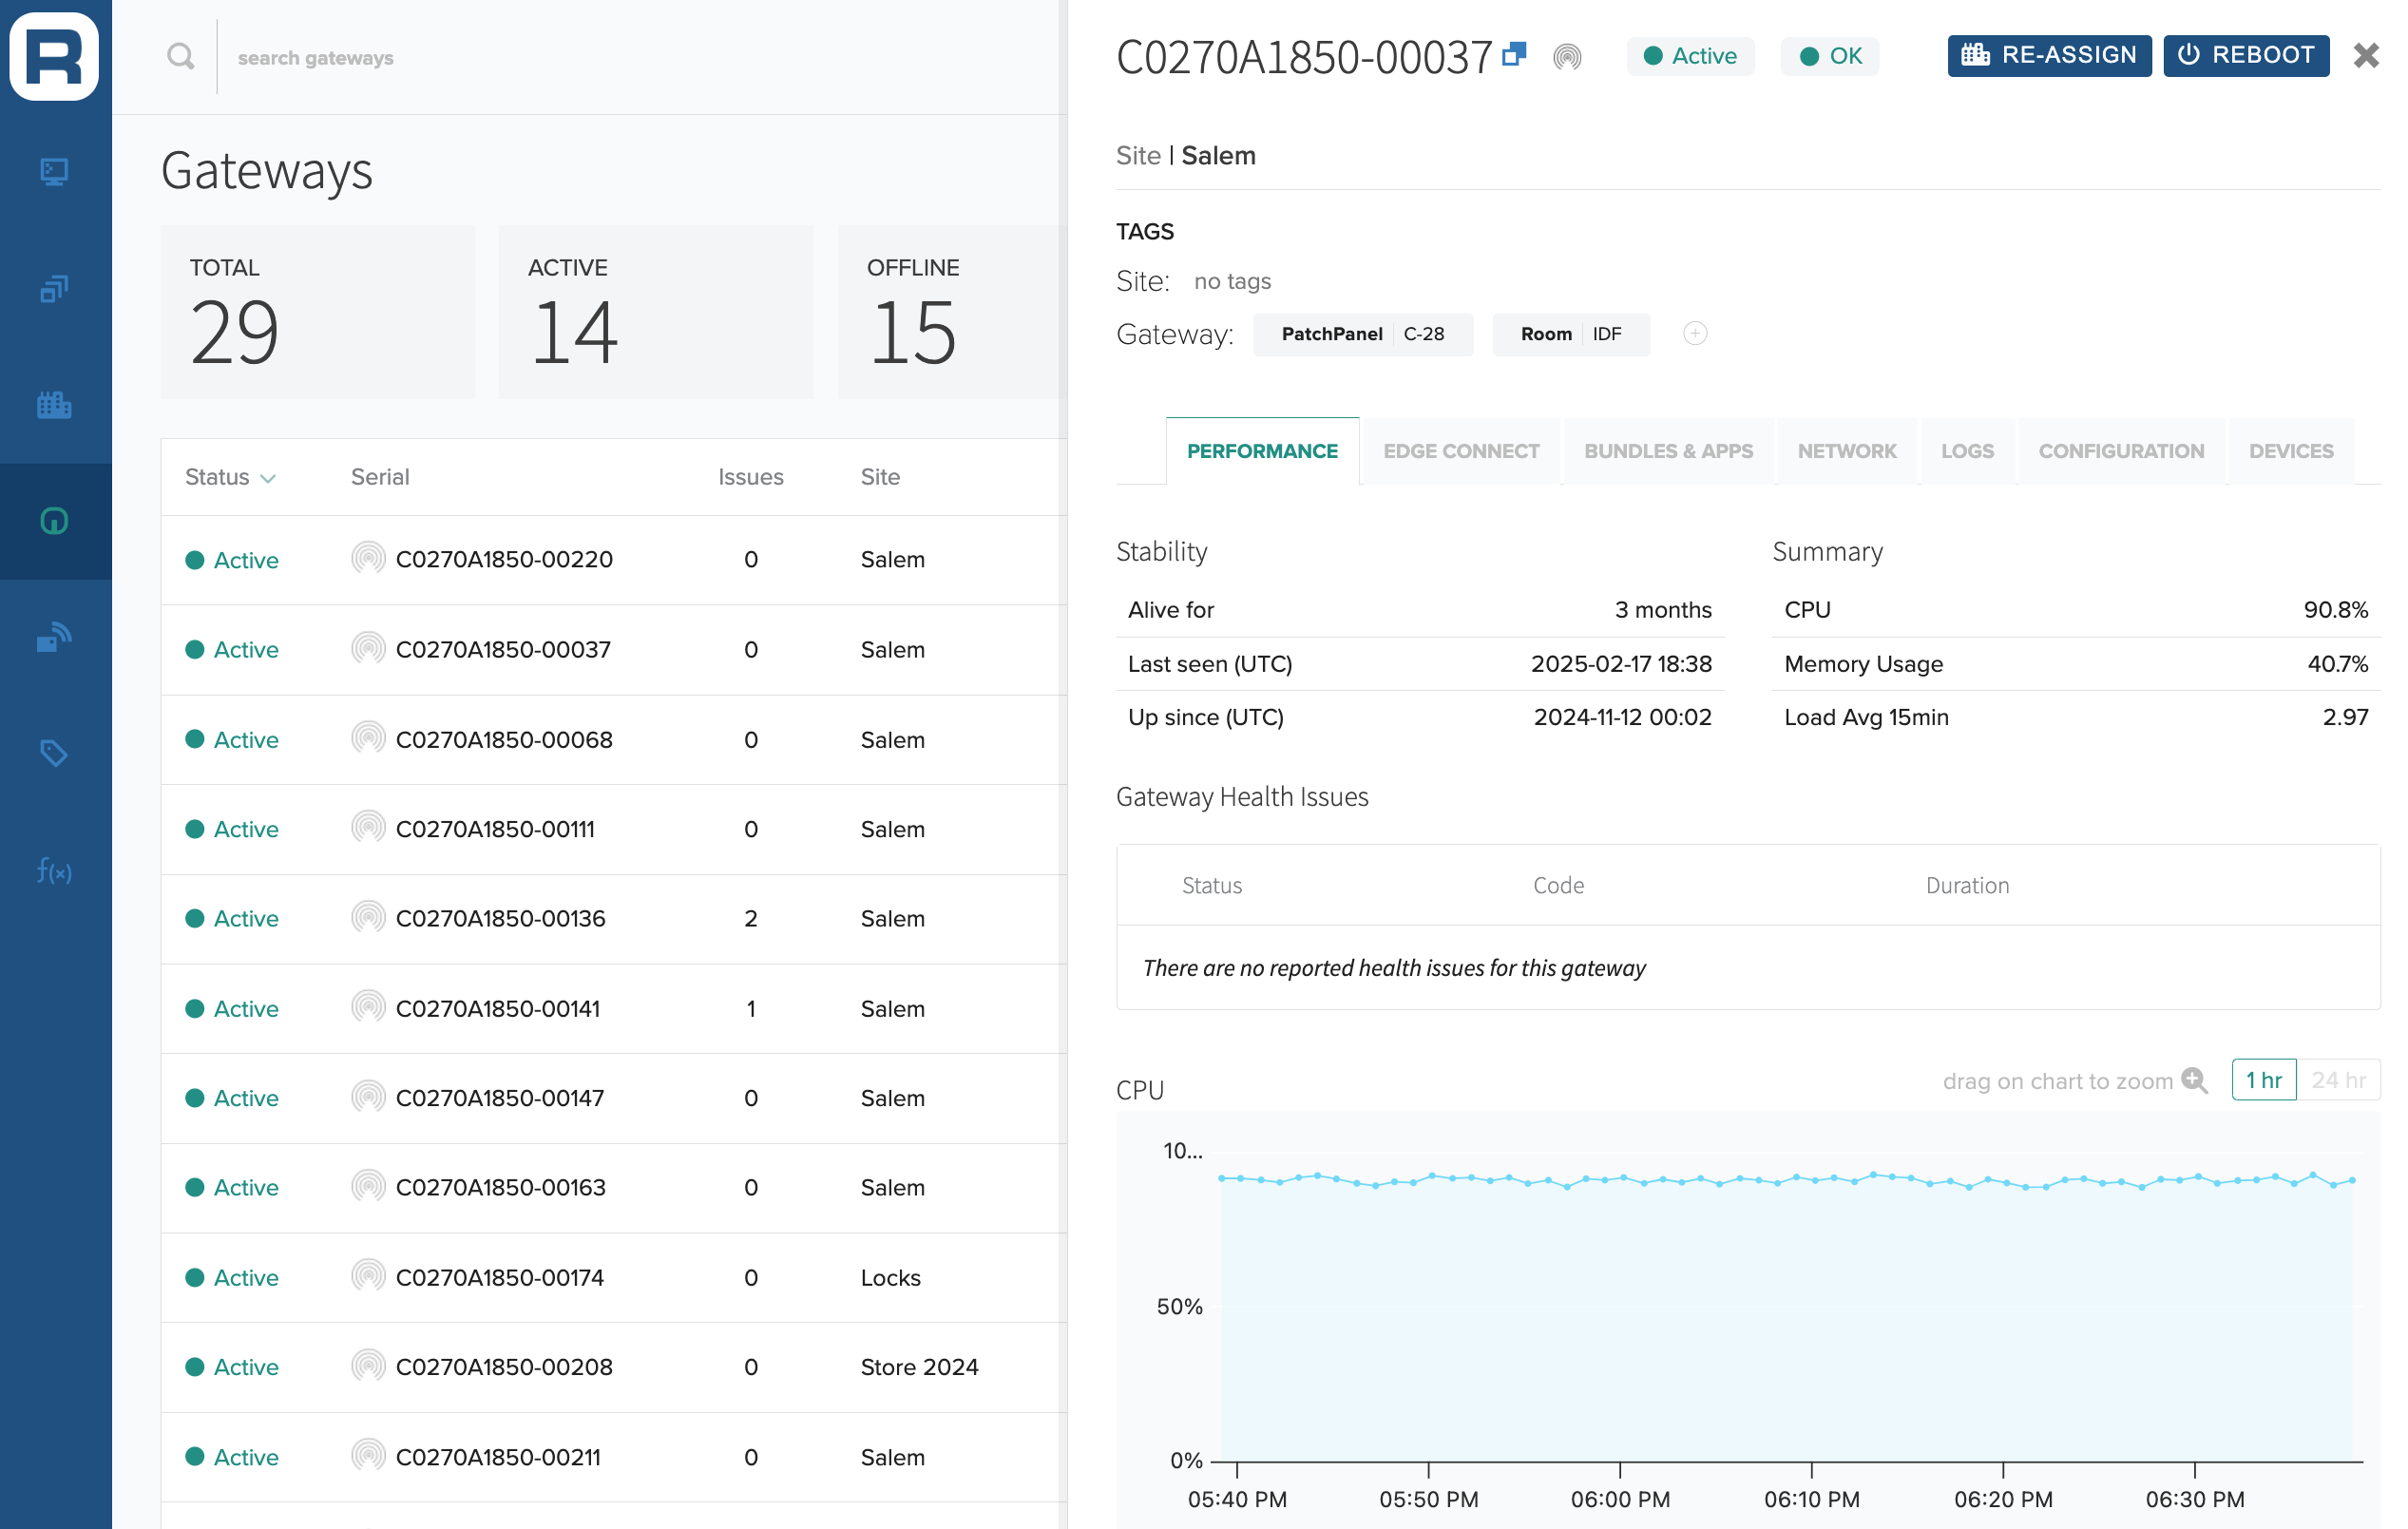
When a Gateway is selected from the list, the app presents a detail view. The detail view provides Gateway health & performance insights along with the ability to manage Configurations and settings.
Gateways can be assigned Tags, which gives users an easy way to add context metadata to Gateways both individually and across a Site. These can be used to denote things like physical location, network subnet and IoT solutions enabled.
If the Gateway is assigned to a Site this area will also show any applicable site tags.
Assign & Re-assign buttons can be found at the top of the detail view. This allows users to quickly assign or re-assign a Gateway to a new Site when installed or moved between Sites when updating configuration.
Gateway Reboot is found at the top right corner of the Gateway detail view. Press the button and wait about 5 minutes for your Gateway to come back online.
Gateway Performance Tab
The Performance tab provides a high-level summary of the Gateway health and performance metrics. It provides health history on length of time Gateway has been Alive for and first/last check-in. Performance also gives a snapshot of Health Issues, current and historical performance metrics of CPU, Memory, and Disk utilization percentages. A historical graph of each metric is available, plotting metrics for a one-hour or 24-hour period. You can click and drag to select a narrower time window.
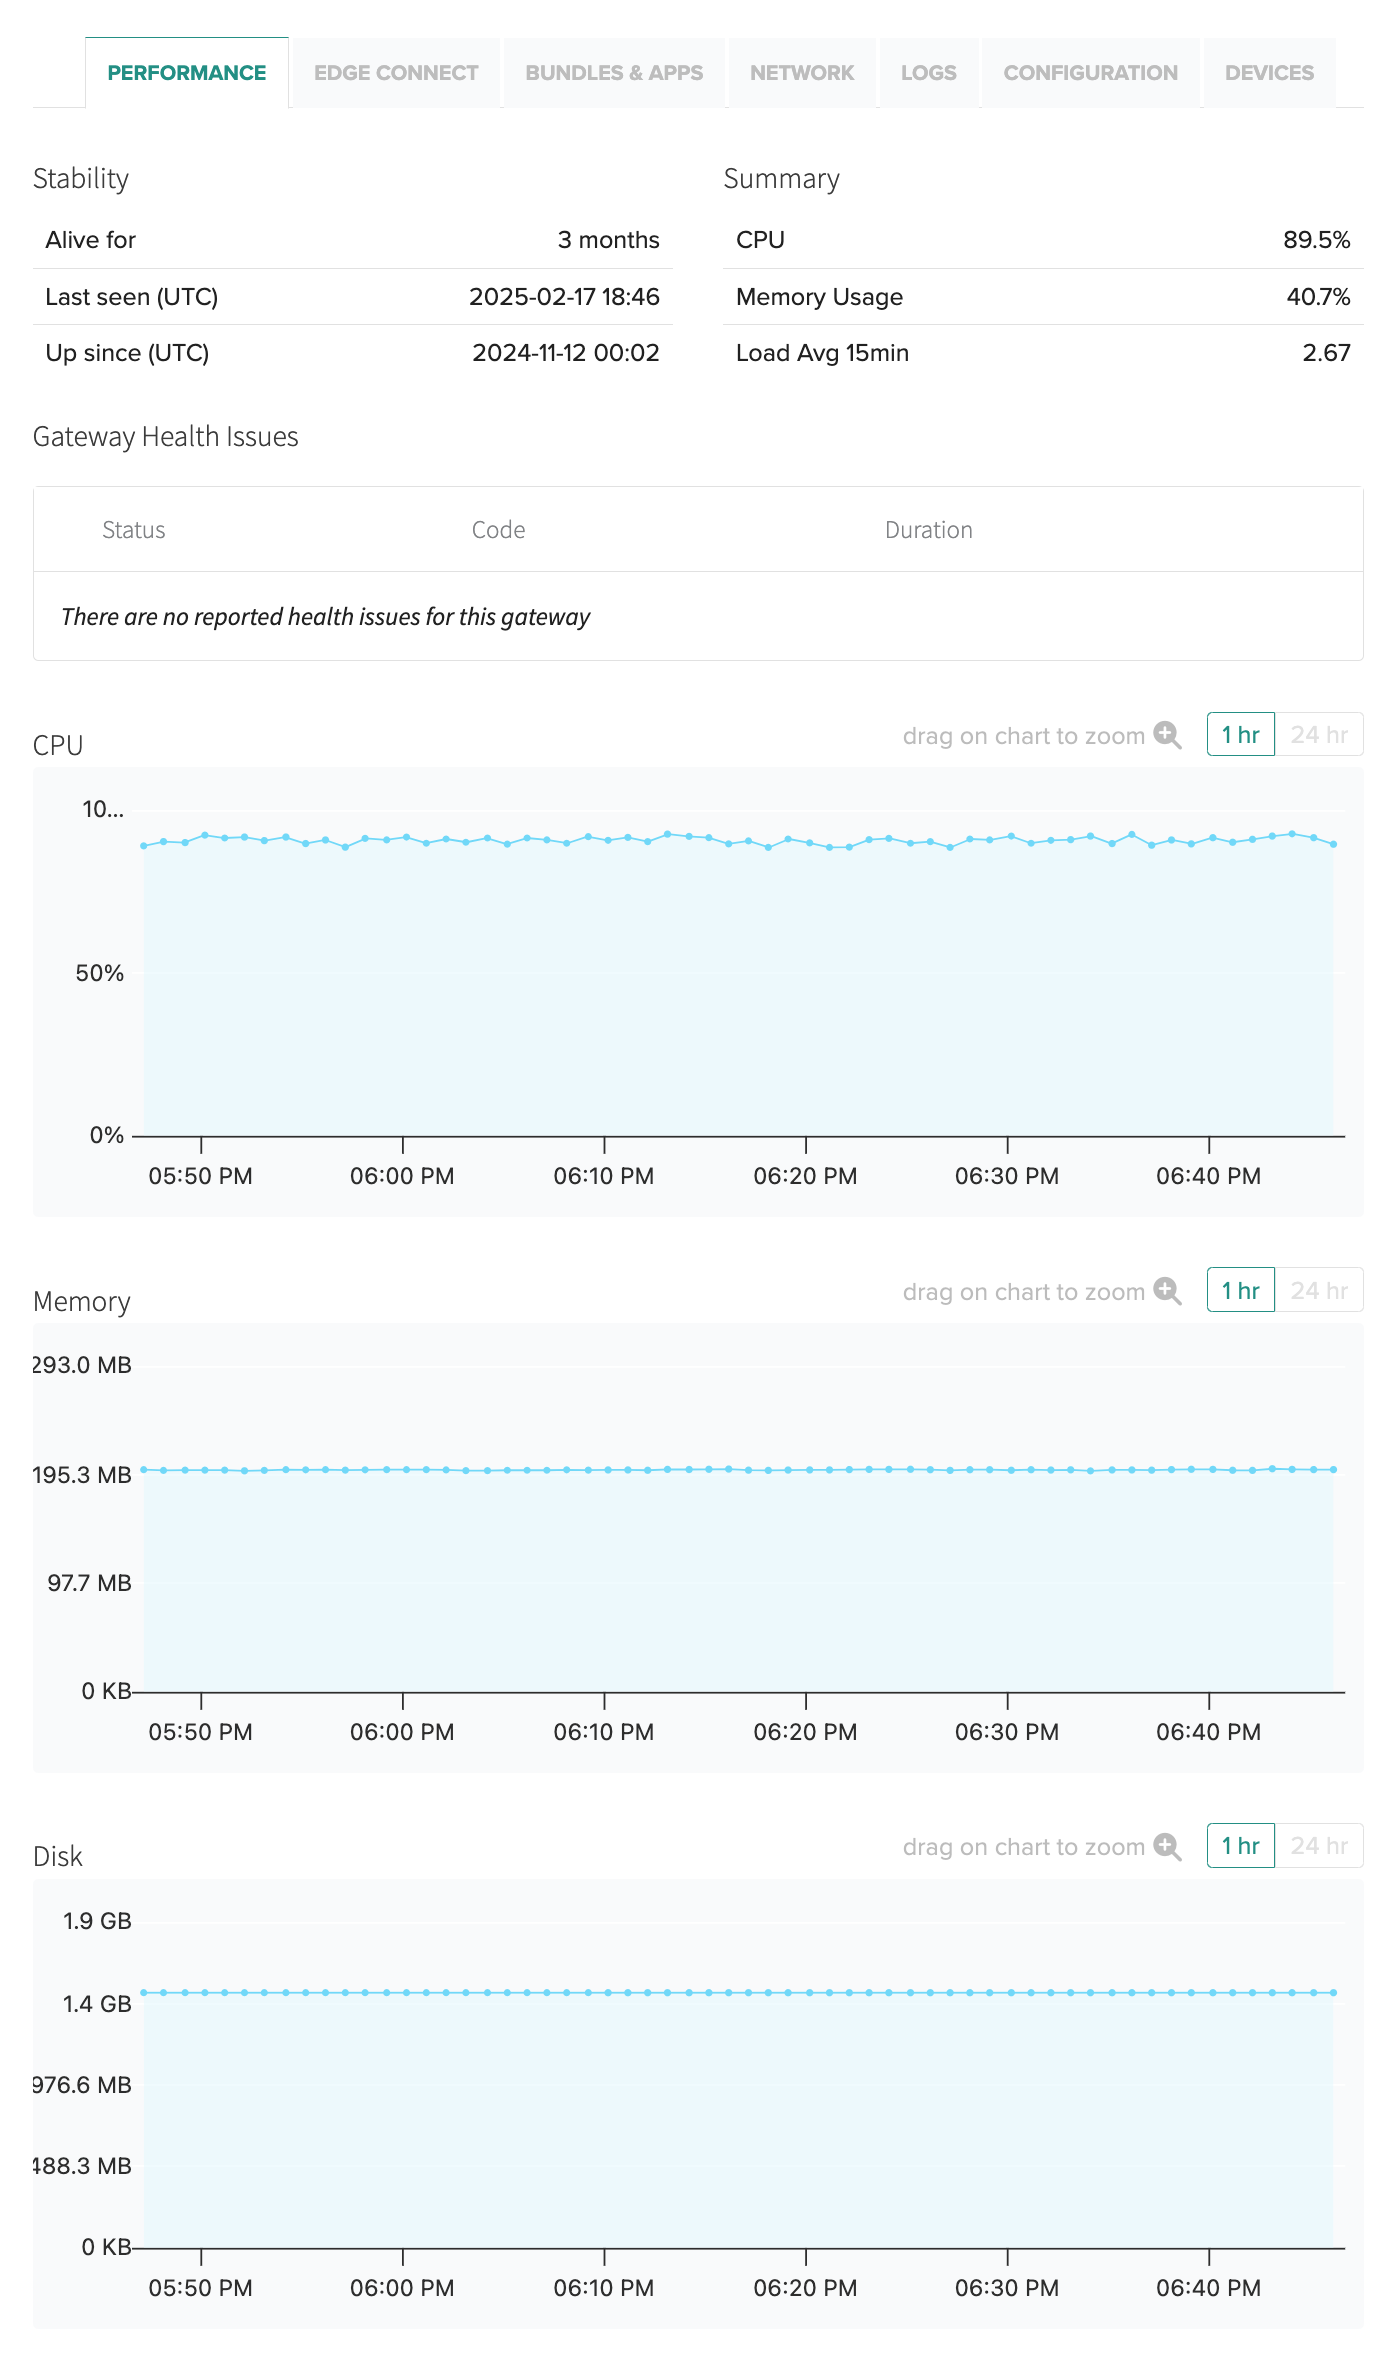
Gateway Health Issues Table
The Health Issue table in the Performance tab displays any issues for the Gateway. Each issue will provide a Status, Issue Code, Duration of time in issue state, and a detailed message about the issue. For more details on Issue codes and resolution see the Issue Codes documentation
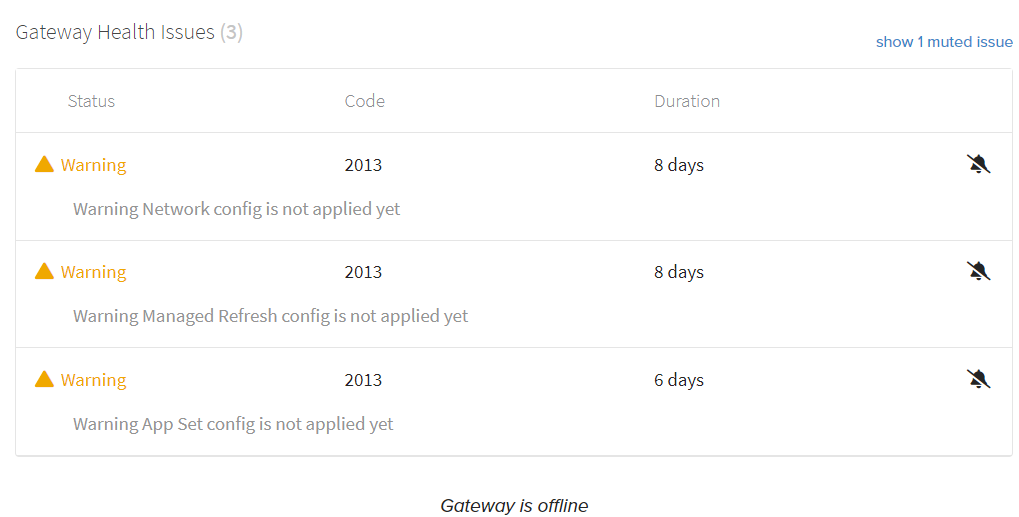
Gateways will automatically calculate overall health based on the Issues currently reported and will default to the most severe status issue present. For example, if a Gateway has 3 Warning issues and 1 Error issue, it will set the Gateway Health to Error. This status is visible at the top of the Gateway Pane next to the online/offline status and Serial Number. The possible Health states are:
Error - Gateway has an issue that is preventing normal operation that needs addressing before it can resume operation.
Warning - Gateway has an issue that impacts desired functionality and may limit performance, reliability, or can cause transient outages.
Inactive - Gateway has some functionality disabled or not currently running. The impact to other systems is typically limited or negligible.
OK - Gateway is operating as configured and there are no active Issues to report.
Issues can be managed via Muting if users no longer wish to be notified of a known issue. Muted issues will not be included in Site Health roll-up logic.
Gateway Edge Connect Tab
The Edge Connect tab offers an in-depth view into the health and activity of the Bluetooth® network managed by each Gateway. This tab centralizes IoT network performance and health metrics, including Device groups, Events, and IoT Cloud connections, allowing users to monitor network stability with metrics such as uptime, event counts, dropped events, and cloud connectivity.
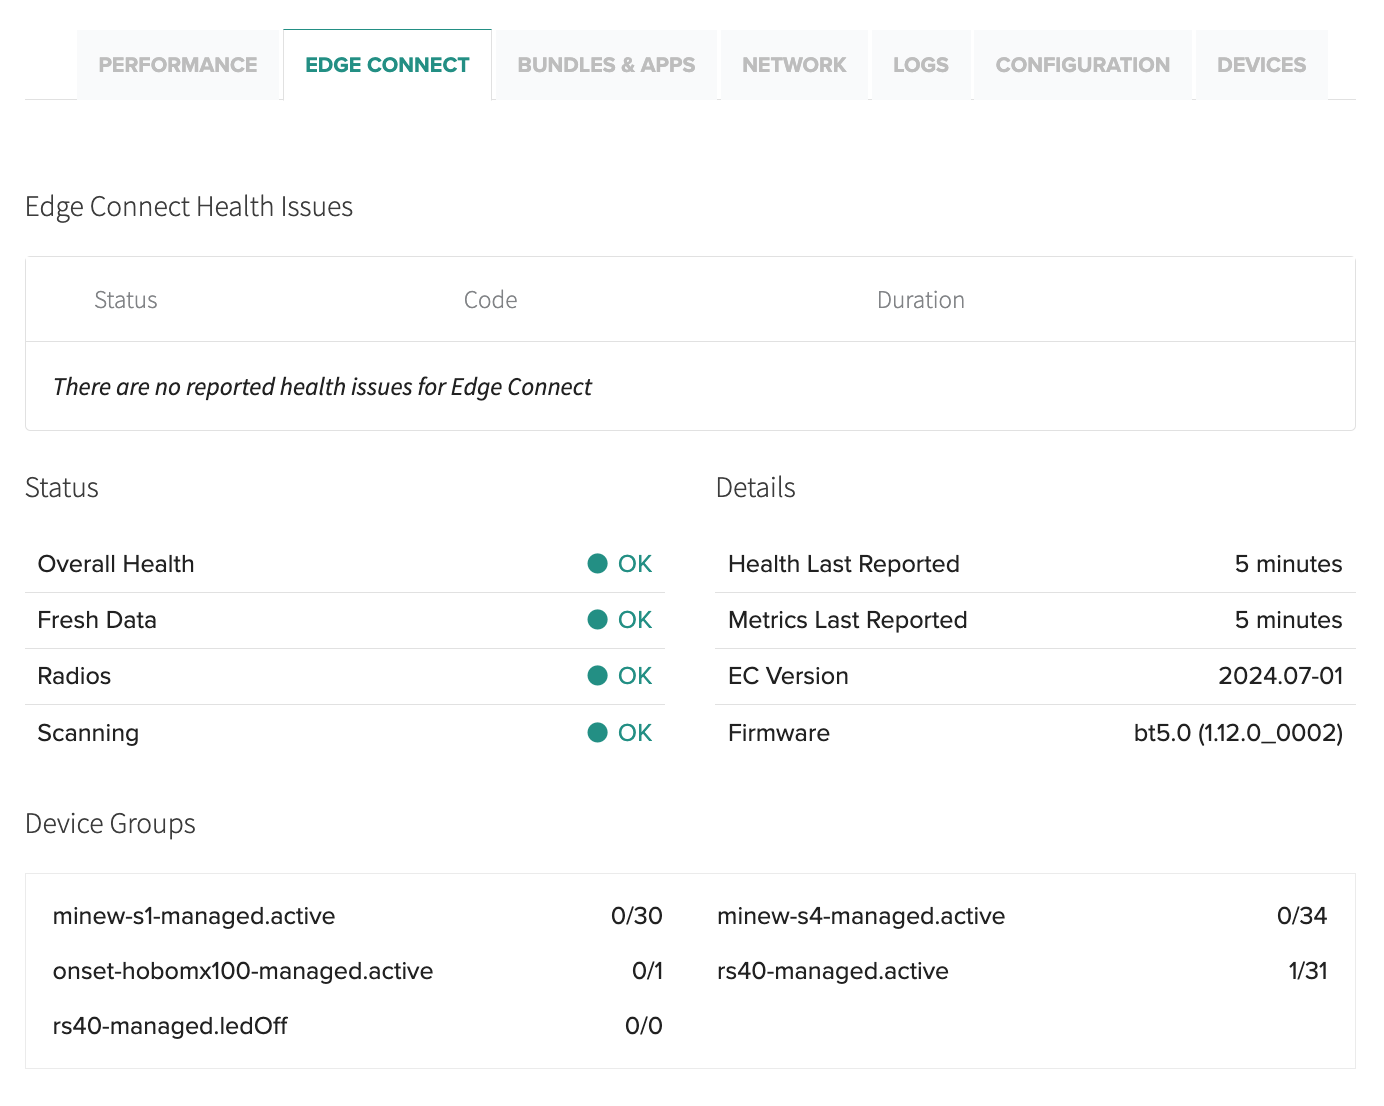
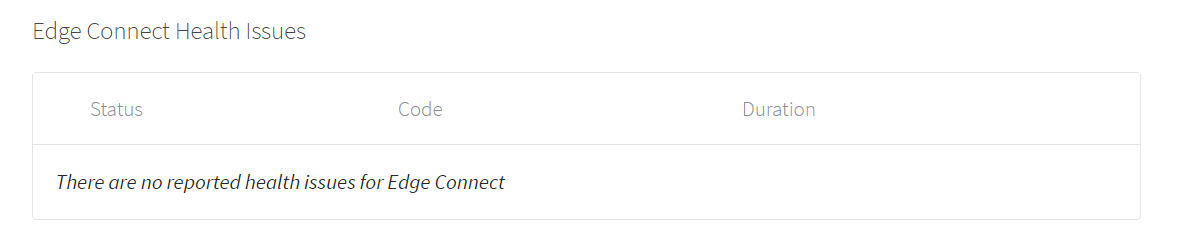
Edge Connect Health Issues Table
Displays any Edge Connect related health issues for the Gateway/AP. For more details on Issue codes and resolution see the Issue Codes documentation
Status and Details Tables
The Status and Details sections provide an overview of Edge Connect's health, connectivity, and operational metrics.
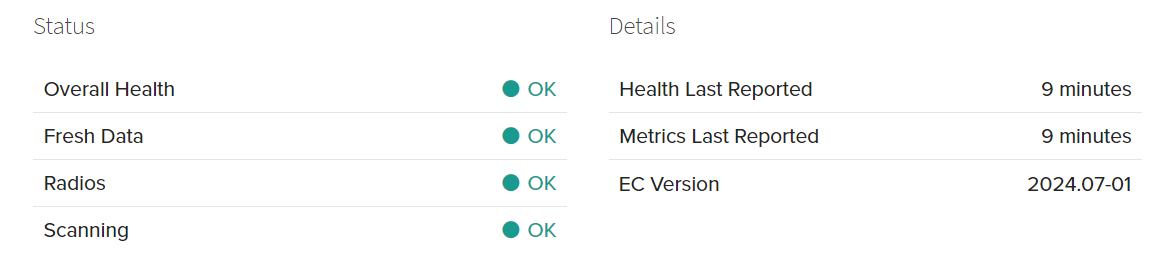
Status
Overall Health - Roll up health of Edge connect, includes all radio, edge processing and publishing functionality.
Fresh Data - indicates Edge Connect is actively reporting with a 20-minute timeout interval.
Radios - health status of all radios being used by Edge Connect.
Scanning - health status of Edge connect scanning for IoT devices and traffic
Details
Health Last Reported - time since the last Health Report was received (default refresh interval: 10 minutes).
Metrics Last Reported - time since last Metrics Report was received (default refresh interval: 10 minutes).
EC Version - version of Edge Connect software in use.
Firmware - IoT radio firmware build and version running on used radios.
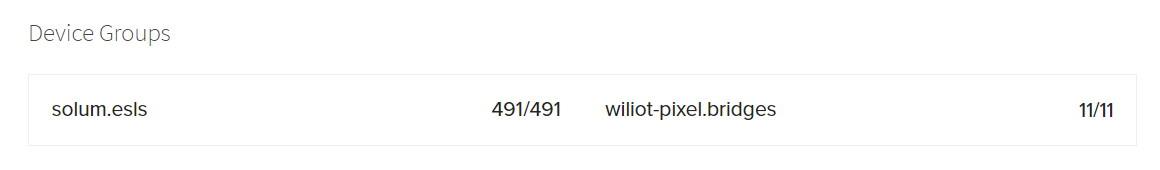
Device Groups Table
Lists all Device Groups that Edge Connect is configured to manage. The counts fore each group are the number of matching Devices of under active management by this Gateway our of total seen. For more details on Devices, refer to the Devices tab.
Cloud Connectors Table
Provides an overview of all clouds to which Edge Connect is configured to connect and report IoT data to. Each connection includes details on connection status, publishing activity, and error counts.
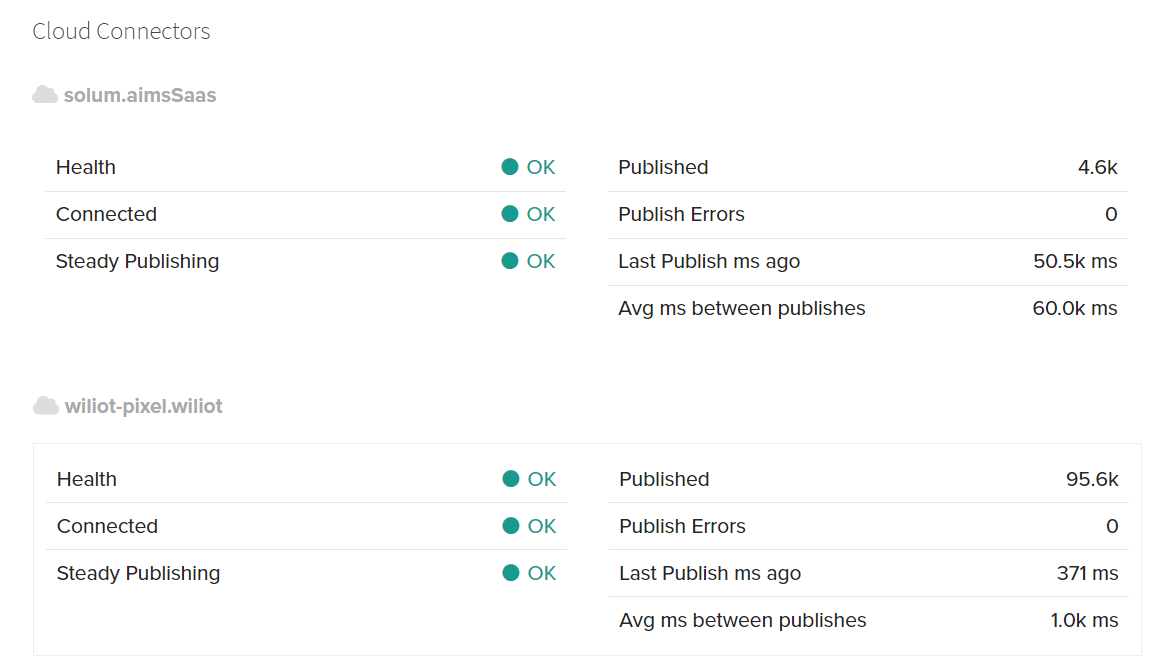
Health - overall status of the cloud connector, summarizing other indicators.
Connected - status of the cloud connection as of the last metrics report.
Steady Publishing - alerts if the publishing rate has significantly changed from the historical average, which may indicate issues with cloud connection or Device activity.
Published - total number of payloads published to the cloud since the last Gateway boot.
Published Errors - total number of errors encountered while attempting to publish since the last boot.
Last Publish ms ago - time since the last successful cloud publish, as of the last metrics report.
Avg ms between publishes - running average of the interval between publishes since the last boot.
Events Flowing Table
This table provides a detailed view of the Edge Connect events being triggered and run. As an event-based platform, Edge Connect reacts to changes in input by triggering events, which in turn activate pipelines to transform data or execute actions. The table displays the count of all defined events that have been run, offering rolling snapshots for the last minute, five minutes, fifteen minutes, and the total since the Gateway boot. Many events are Recipe specific for processing Device specific actions.
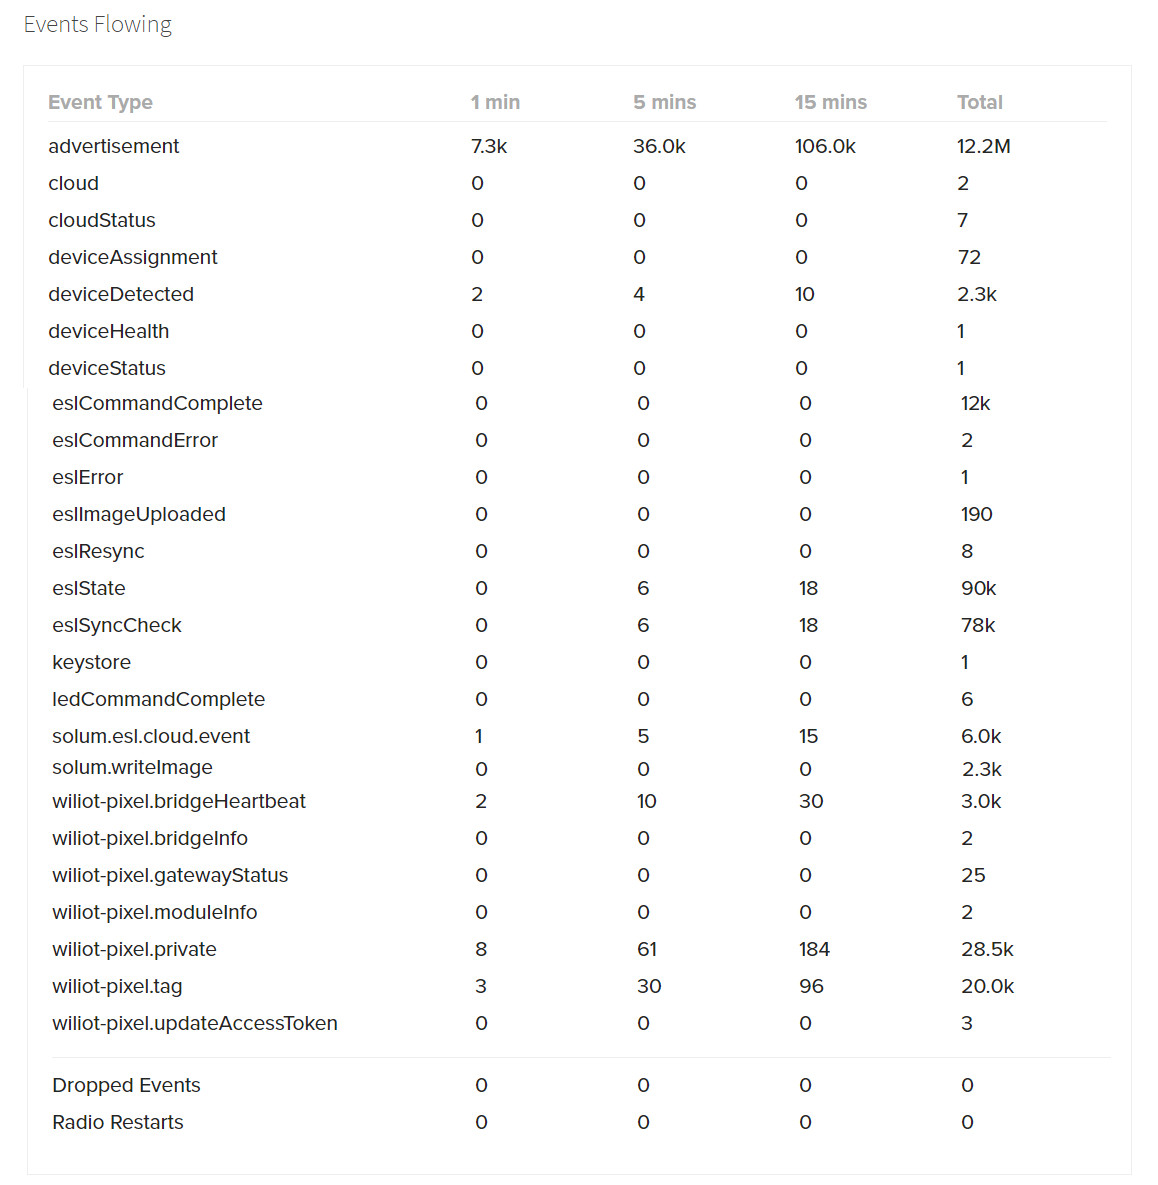
Some events of note for Edge Connect that are common across Recipes are:
advertisements - individual BLE advertisements processed.
deviceDetected - events where a new Device of a configured device group is detected for onboarding.
deviceHealth - health status reports for devices in the network.
deviceStatus - updates on the operational status of devices.
Dropped Events - instances where events were not successfully processed or were lost.
Radio Restarts - events triggered when a IoT radio is restarted in order to recover from an issue.
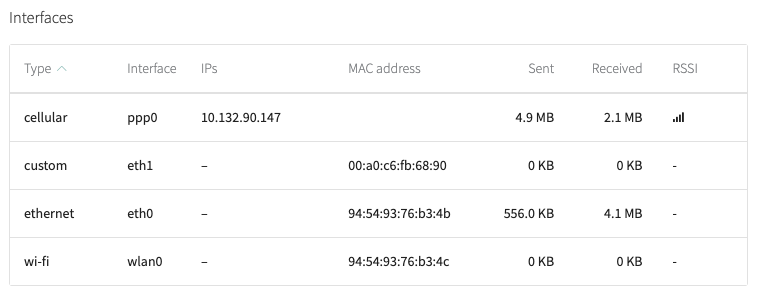
Gateway Network Tab
The Network tab provides information about each network interface on the Gateway. This includes the type of interface, IP addresses, MAC address, amount of data sent and received, and signal strength (RSSI).
Data sent and received metrics are a total of all data sent for each individual network interface, since last system boot, corresponding to Alive time in performance tab.
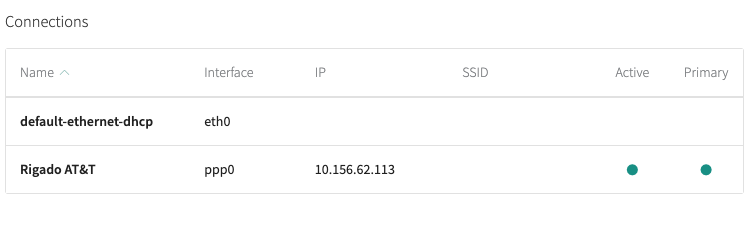
A list of connections is displayed with information for each available network connection on the Gateway. This includes the connection name, the interface it's associated with, its IP address, SSID, whether it's active and whether it's the Gateway's primary connection.
If using a 500-W Gateway with a cellular connection, a Network Configuration section will be available showing the cellular settings for that gateway.
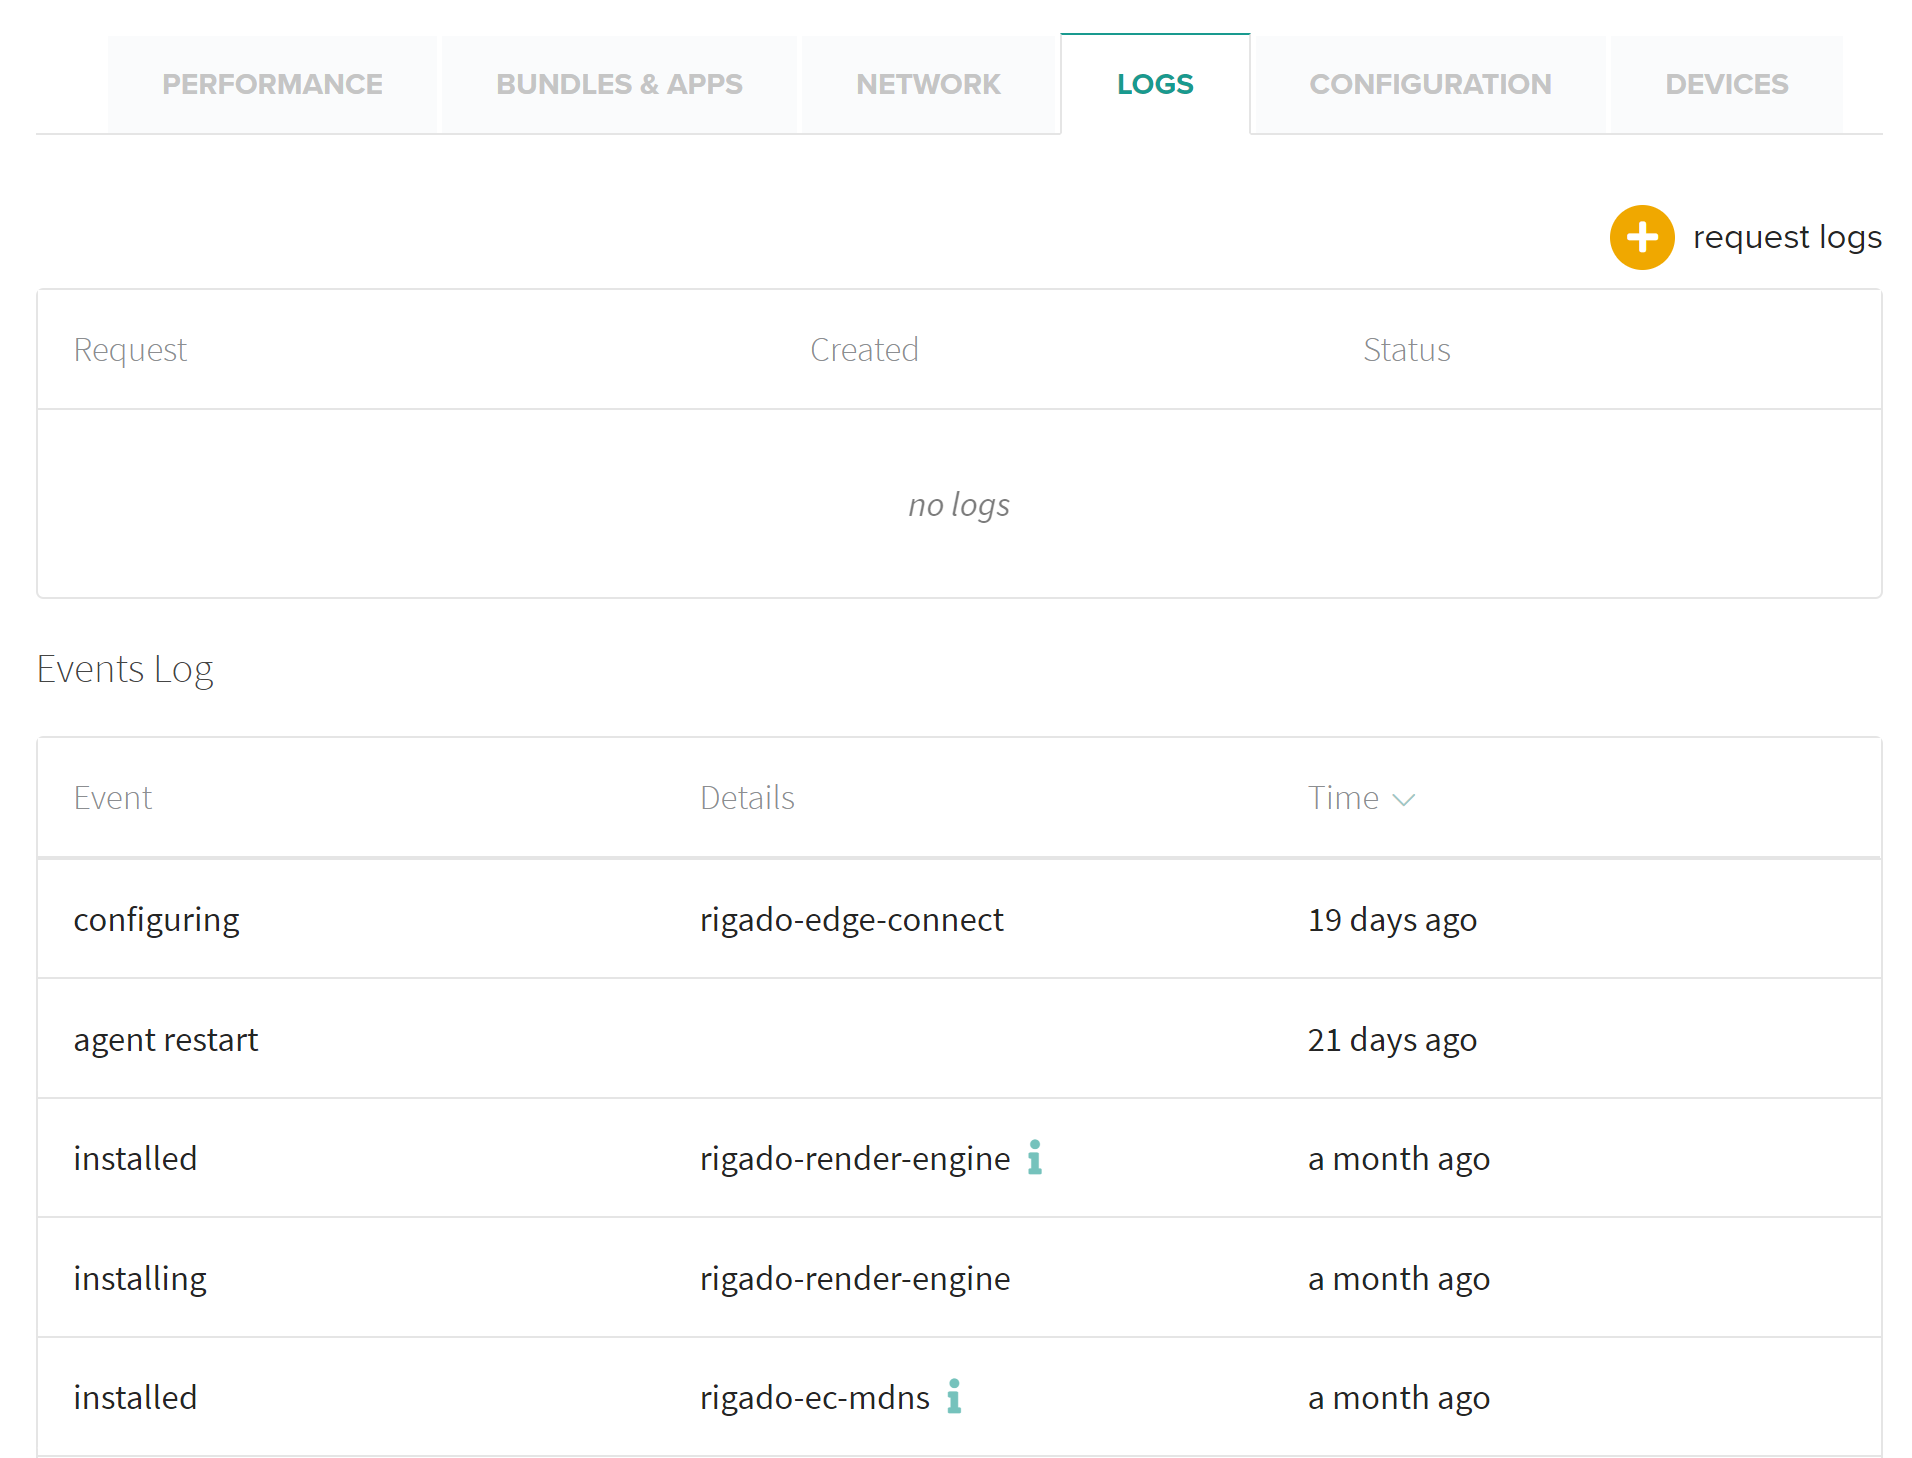
Gateway Logs Tab
The Logs tab will show an Events log that displays Gateway-related events like installs, updates and reboots. From this view you can also select request logs to obtain the latest set of system and application logs from the device.
Use caution when requesting logs from a Gateway when the primary interface is cellular. Uploading the logs may consume a lot of data, potentially exceeding the amount of data available in the cellular plan.
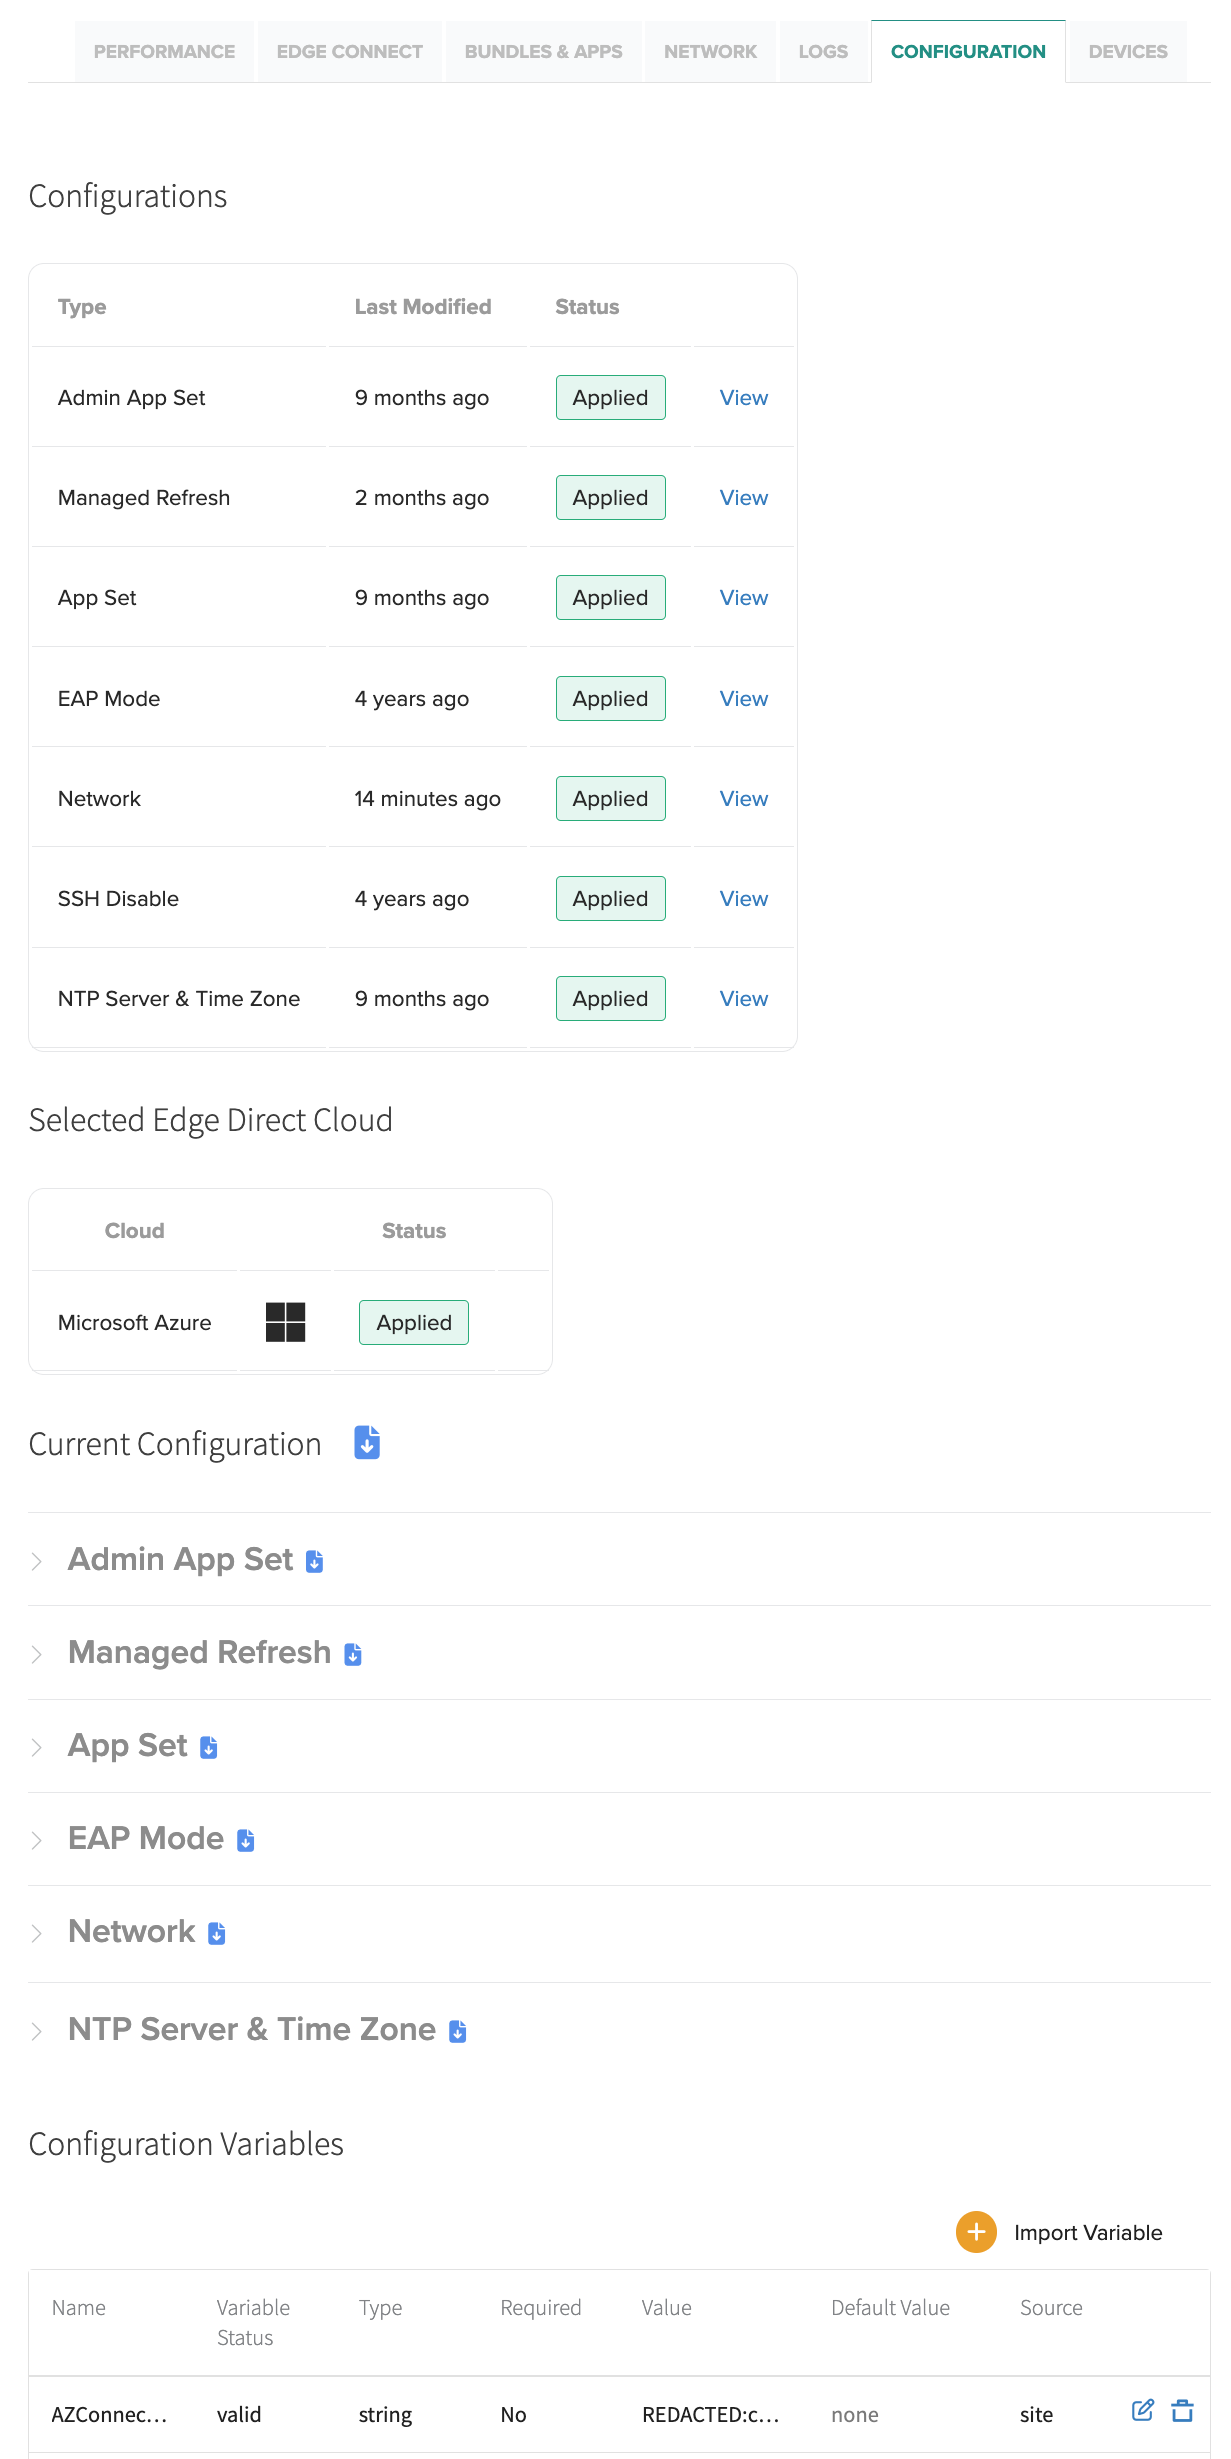
Gateway Configuration Tab
The Configuration tab of the Gateway will display the Status of all configurations applied to the Gateway, along with any configuration variables configured to the Gateway. The types of configurations available for use on Gateways Are:
- App Set: Controls the settings for IoT data & connectivity applications, specifically Edge Connect. This category applies to both Gateways and third-party hardware running Edge Connect containers.
- NTP Time Server: Controls the time-server settings of Gateways.
- Network: Controls the network backhaul interface Configurations of Gateways.
- Managed Refresh: Controls the minimum revision of system software of Gateways. If a Gateway is running software below the minimum revision, it will trigger a secure update.
- Edge Direct Cloud: Controls the Gateway cloud hosts used to communicate with Edge Direct. Current options are Azure or AWS clouds.
This view will also show the configuration status of each type and last time it was modified. Details of what the configuration contains can be viewed by clicking on View in line with the Configuration type. For more details on how Configuration works, see the Configurations Section.
Configurations are Primarily managed through Sites. Configurations will only be editable in the Gateway Configuration tab if it is Unassigned. However, this will not perform any configuration variable substitution.
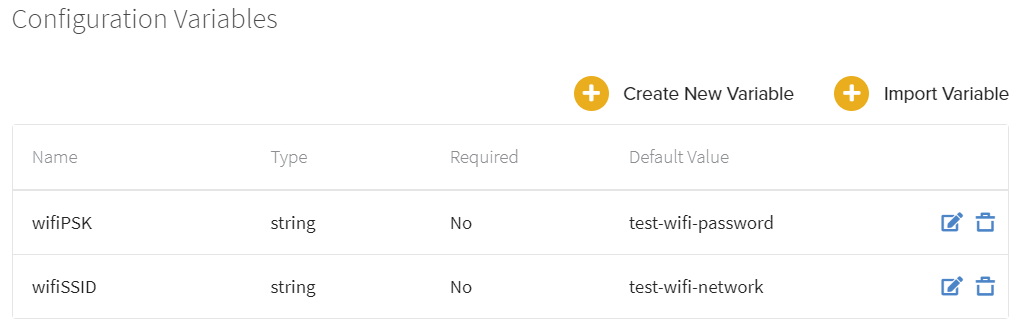
Configuration Variables are used to substitute unique values into common configurations when using Sites to configure Gateways. For more information see Assigning a Configuration Variable to a Gateway
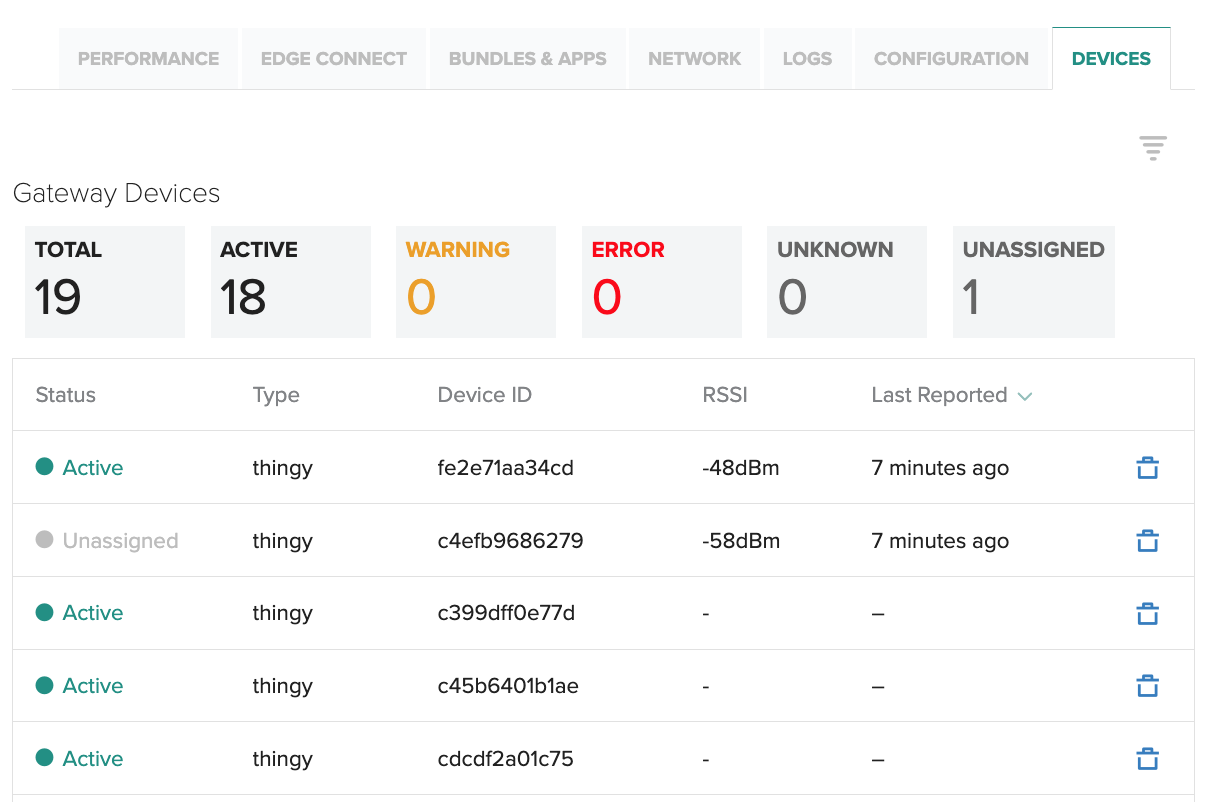
Gateway Devices Tab
The Devices tab of the Gateway will display information for connected devices. Devices connected to the selected gateway will show device type, status, device ID, RSSI, and time last reported.
For more information on devices management see Devices
Updated 11 months ago